
Morph Magic for Incredible Effects in PowerPoint – Richard Goring
Richard Goring is a concurrent and BYOD session speaker at this year’s Learning Solutions Conference and Expo. In this guest post he shares tips for using some fascinating new PowerPoint functionality in Office 365.
Slide transitions in PowerPoint have never been very exciting, nor, more importantly, useful. And then Microsoft introduced a new transition called Morph and it changed everything. Suddenly, transitions can be one of the most useful tools in PowerPoint to help you create dynamic, visual sequences that engage your audience and effectively communicate your message.
So, what does it do? You’ll laugh if you’ve ever used Keynote, which has had this feature for years. Morph recognizes any duplicate objects across two slides and will then seamlessly ‘morph’ from one slide to another. If a duplicate object is in a different position on the second slide, then it will move, replacing the need for motion path animations. But morph can also be used to make objects change size, or shape, or color. And if you really push it, there are some incredible things you can do.
It only works with Office 365, but assuming you have that, what can you do? Well, Morph allows you to skip the need for a lot of complex animation you typically need for dynamic visual storytelling, and you can just spread content over several slides. Imagine things like panning across a timeline, bar charts growing and shrinking, or people moving across a site map.
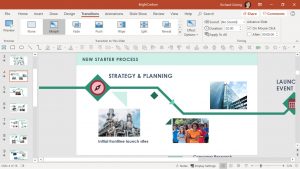
One technique I think is worth the subscription alone is the Prezi-like functionality Morph gives you, but without the motion sickness-inducing effects. Consider an infographic that you’ve used on a website or poster.

A great communication tool, but often terrible in a presentation, as it’s far too detailed to see what’s going on, and everything is crammed onto a single slide. With Morph, you can put the infographic on one slide, which gives your audience an overview of the entire thing. Then, duplicate the slide (click on it in the thumbnails pane on the left and use Ctrl + D) and on the second slide, resize and reposition the infographic so that you can see a useful section of it on the visible area of the slide – perhaps the first part of a process or the introduction.
Now duplicate that second slide to create a third, and resize and reposition the infographic so that you’re framing a different part of it. Keep doing this until you’ve captured all the detail of the infographic at a scale that your audience can see and understand.

Select the slides you’ve created and go to the Transitions tab on the ribbon. Find Morph, which is second from the left (between None and Fade), and then go into show mode (F5 on the keyboard). Now, click through and watch how you first zoom into the infographic and then effortlessly pan around it, showcasing the detail your audience needs to see.
If you had endless time, that would be possible using standard animation functions – just. But there are some effects that are totally new. For instance, creating a zoom lens that highlights content as you pan a magnifier around the slide, or revealing part of a blurred image, or layering up content to create augmented reality type slides with cut-aways. It’s remarkable.
Want to find out more tips and tricks for using PowerPoint in clever ways? Richard has a number of sessions on the topic throughout Learning Solutions 2019. Find out more at his presentation at the How I Made This event on Monday, March 25 from 4:00-6:00pm, his Create Compelling Infographics in PowerPoint session on Tuesday, March 26 from 1:00-2:00pm, and his extended length BYOD session BYOD: Mind-Blowing PowerPoint. No, Really! on Wednesday, March 27 from 2:30-5:00pm.
Leave a Reply